In 2021 the Towards Zero Foundation and the Parliamentary Advisory Council for Transport Safety have published a report with accompanying dashboard which assesses road safety performance by local authority area. The analysis looks at previous collision records by local authority and police force and estimates the level of ‘under-performance’ compared to the stagnation in road casualty reduction seen post 2010.
The Index, and the analysis included in this report, focus on the majority of casualties which occur on roads under local authority control. It includes data to:
- Compare road risk between areas, using the number of deaths or serious injuries per 100,000
population - Compare performance in the most recent three years(2017‐2019) with the start of the decade
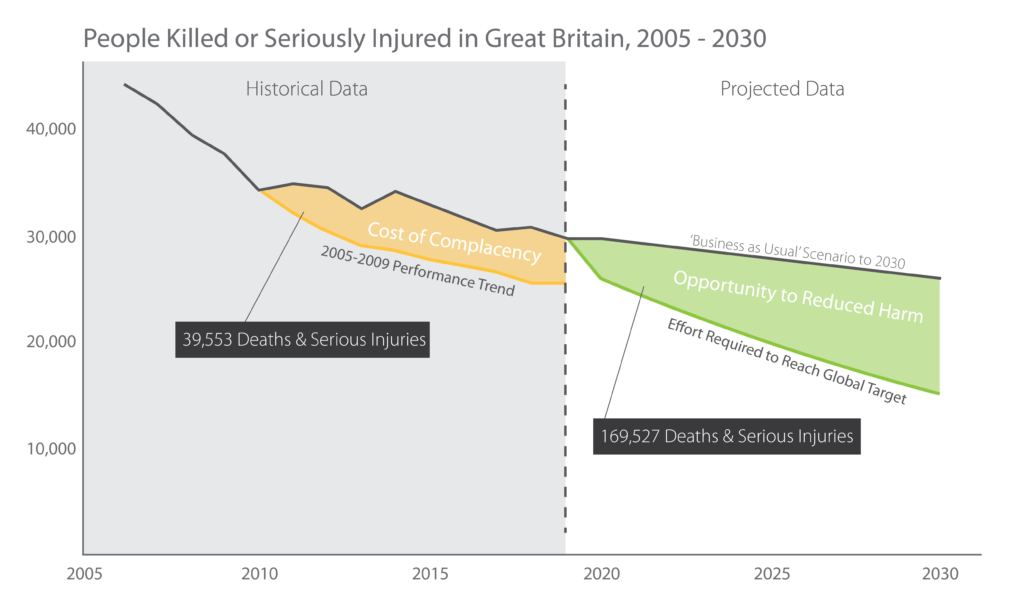
(2009‐2011) - Model trends based on figures from 2006‐2010 if performance had not stagnated
- Model trends on future performance to 2030 if we continue to stagnate
- Show risks to different road user groups, such as pedestrians, cyclists and motorcyclists (online
Index only) - Show average number of different vehicles involved in conflicts that resulted in death or
serious injury (online Index only)
The report shows the best performing and weakest performing local authorities in England, Scotland and Wales in comparative tables. This is not to celebrate success or condemn poor performance but to show the inconsistencies within the picture across Britain and to highlight the opportunities that exist to secure significant gains by embedding best practice across the board.
There are no other national publications that assess performance or risk across Great Britain since road safety targets ended in 2010. Although the index has been warmly welcomed by practitioners there are no long-term plans to keep this updated.